See the workflow. Understand the decisions.
Explore lead handling, IT ticket triage and month-end reporting. These examples use fictional data. Each workflow has been run live with AI on that sample data, and the results are shown below. Connections to your own systems are tested before any client use.
Lead reply and qualification
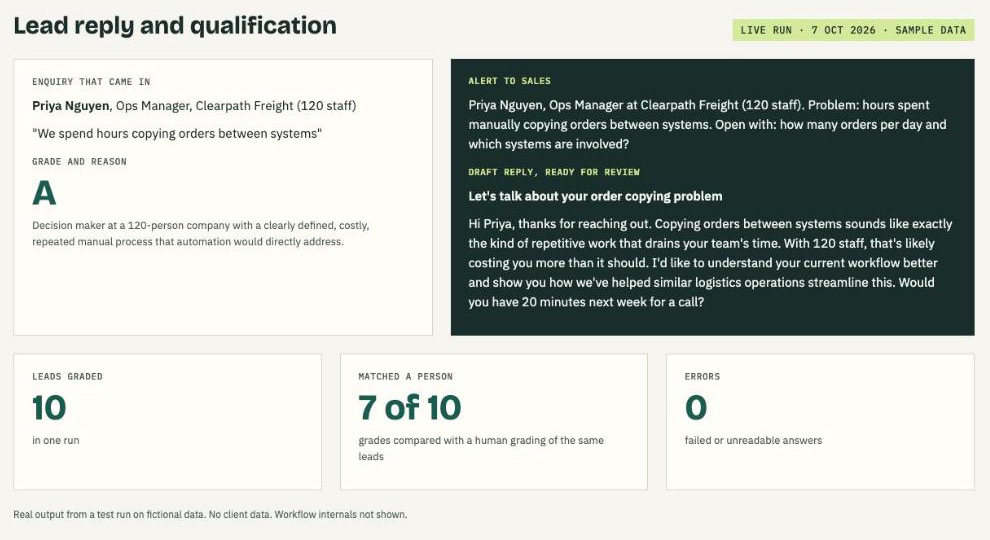
A prospect writes in after hours and hears back two days later. By then they have spoken to someone else. Sales also spends time on enquiries that were never a fit.
- Enquiry arrivesA web form or a shared mailbox in Microsoft 365 receives the message.
- AI reads the enquiryPulls out company size, need, timing and budget, and notes what is missing.
- Rules score the fitFixed rules turn those details into a score. The same extracted fields give the same score under the same rules. AI extraction is reviewed separately.
- AI drafts a replyA short, polite reply that answers the question and offers a time to talk.
- Reply sent, sales toldStrong leads go to sales with a three-line brief. Weak fits get a polite, different reply.
2. Wants to start in six weeks; indicative budget US$15,000.
3. Next step: confirm the migration scope and support requirements.
IT ticket triage with weekly client report
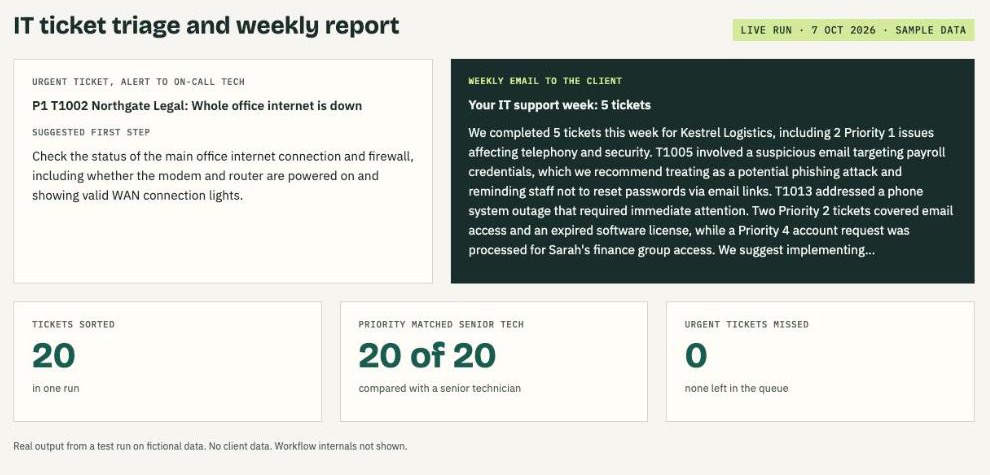
Engineers sort the queue by hand every morning, and urgent tickets can sit unseen. On Fridays someone then spends hours writing each client's summary.
- Ticket arrivesAn email or portal request reaches the support mailbox.
- AI classifies itPicks a category and a priority, and suggests a first fix.
- Rules route itFixed rules decide who is alerted. P1 tickets alert the on-call engineer in Microsoft Teams.
- Logged and acknowledgedThe ticket is logged and the client gets a reply with a reference number.
- Friday: counts per clientCode totals opened, closed and open tickets for each client.
- AI writes the summaryA short plain-English report built only from those counts.
| Measure | This week | Last week |
|---|---|---|
| Tickets opened | 24 | 30 |
| Tickets closed | 26 | 28 |
| Still open | 5 | 7 |
"Fewer tickets came in this week, and more were closed than opened, so the open queue is down by two. The closing open queue is down from seven to five."
Month-end budget vs actuals variance summary
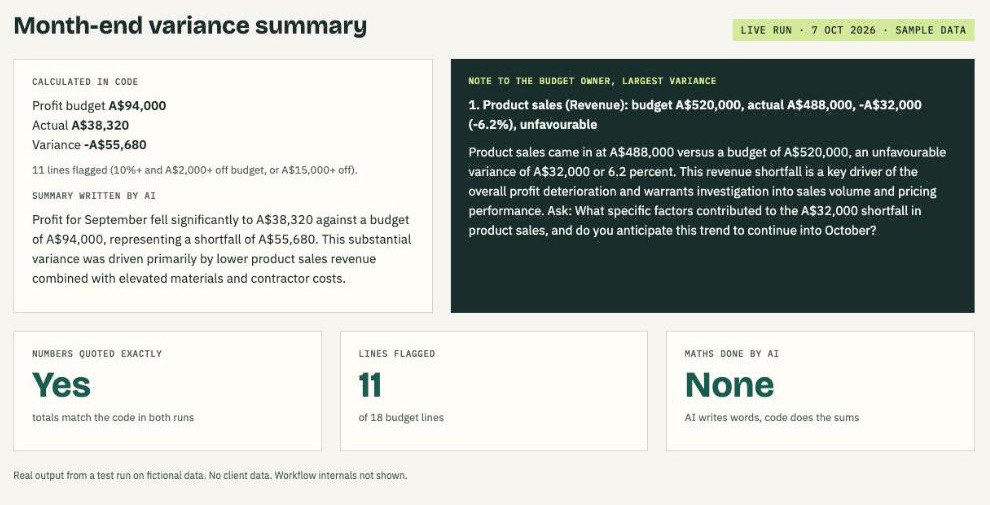
Each month an analyst copies the export into a spreadsheet, builds variance tables and writes a note for every budget owner. It is slow, and a mistyped number reaches senior people.
- Export lands in SharePointThe monthly budget and actuals file is dropped in a set folder.
- Code checks the fileTotals, missing rows and duplicates are checked. A bad file stops the run.
- Code does all the mathsVariance in dollars and percent for every cost centre, calculated exactly.
- AI writes the commentaryGiven the finished table, it writes a short note per budget owner. It does no maths.
- Review, then sendThe analyst reviews the notes before they go to budget owners.
| Cost centre | Budget | Actual | Variance | Variance % |
|---|---|---|---|---|
| Marketing | 42,000 | 47,300 | +5,300 | +12.6% |
| IT | 85,000 | 81,200 | -3,800 | -4.5% |
| Operations | 120,000 | 124,800 | +4,800 | +4.0% |
| Travel | 18,000 | 11,400 | -6,600 | -36.7% |
Positive variance means spending above budget. Colour is paired with the sign, so it does not rely on colour alone.
Looking for websites and online stores? See six sample sites on the Work page.
Want one of these in your business?
15 minutes, no slides. If automation is not the right answer, we will say so.
Request a 15-minute call